
Build and edit your reports right on the page
Edit ContentCrew reports right on the page, pick a source for every number, and save any report as a template. Plus publishing from Claude.
A client wants one more chart, TikTok only, just before the monthly call. In ContentCrew, you now add it right on the report’s page, and building reports this way is the change from this week we’re most excited about.
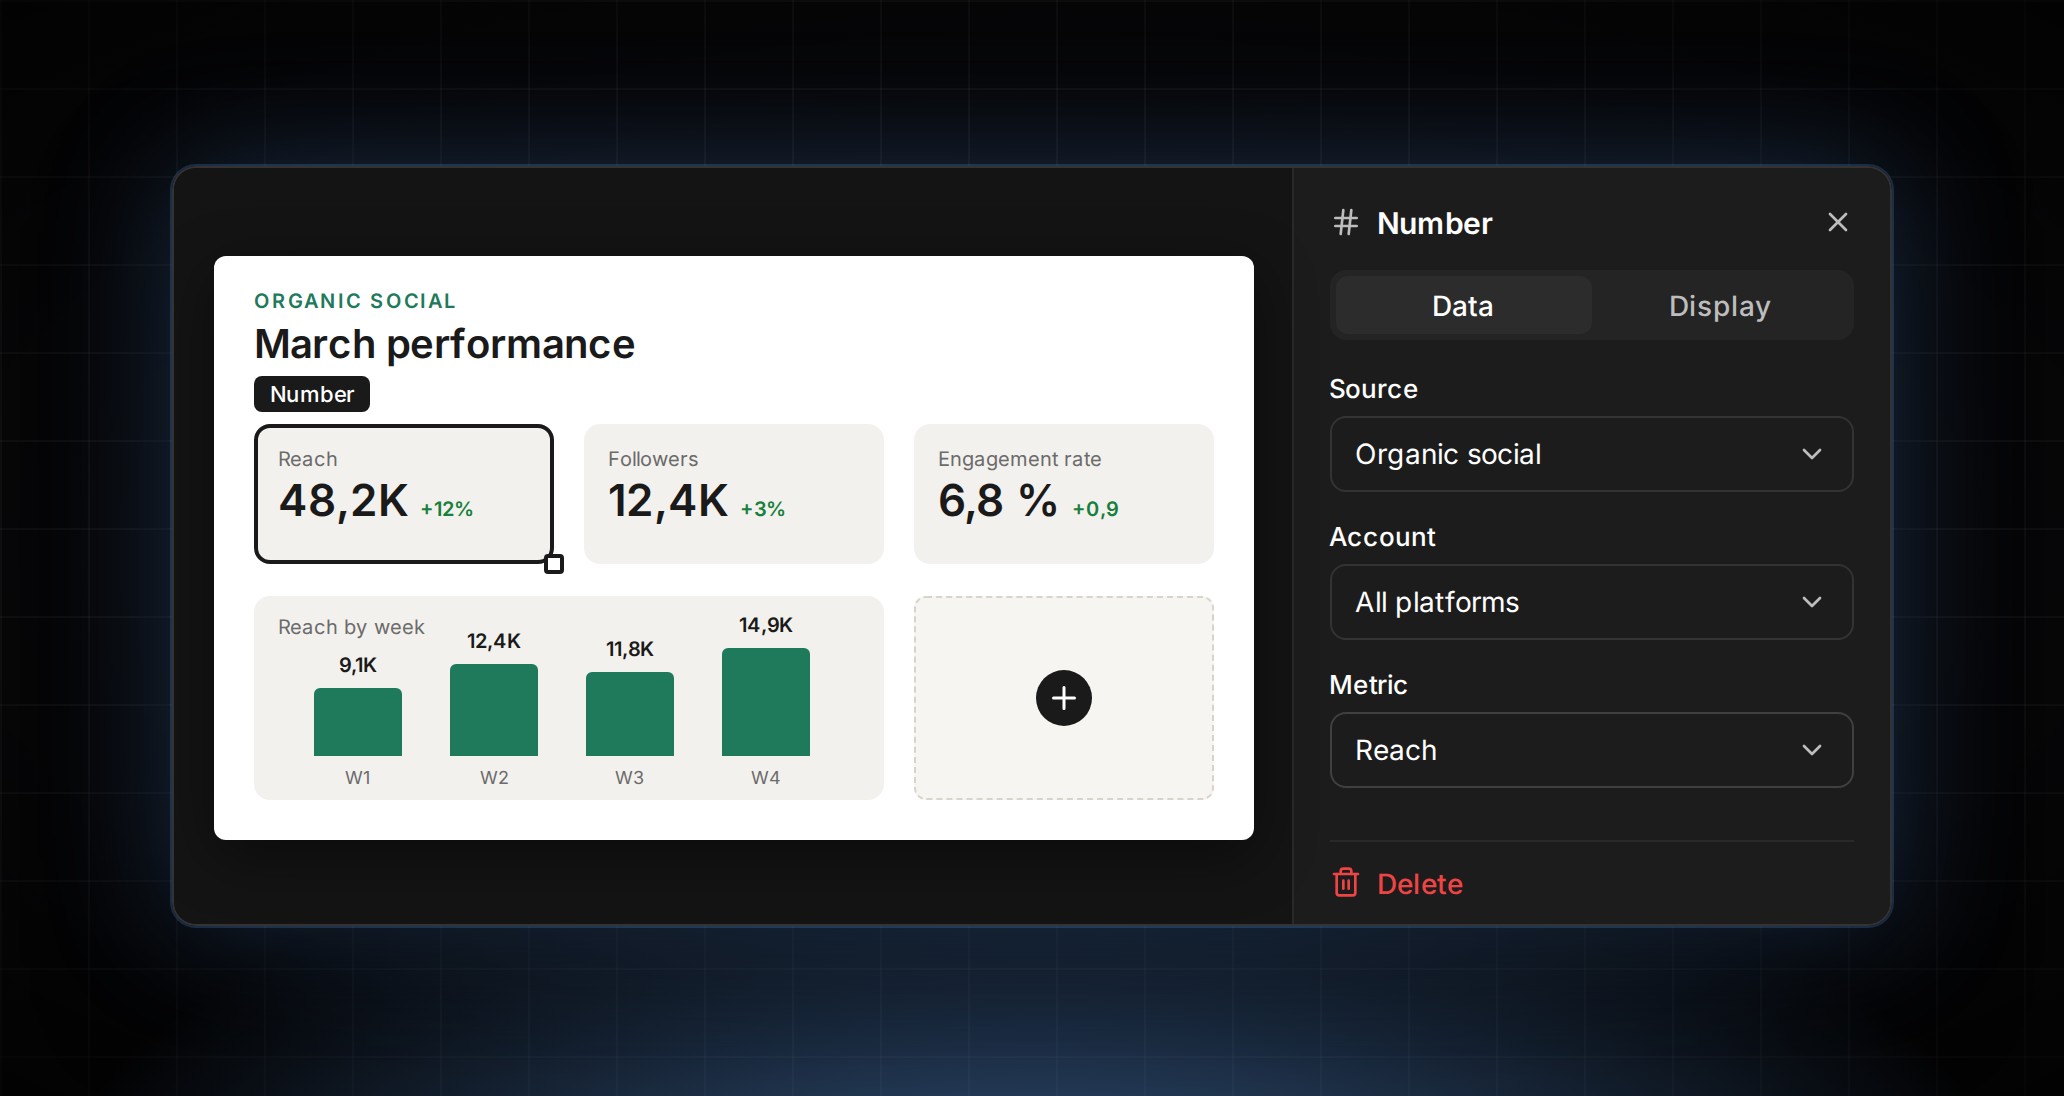
Add metrics, charts, tables, posts, goals, images, or text from the + box, then drag, resize, or swap them where they sit. Every number, chart, and table gets its own source: all social channels, one connected platform, Meta Ads, or TikTok Ads, each shown with its logo. Undo and version history cover every change, so you can try a new layout and step back if you don’t like it.
Once a report works, keep it. Save any report as a template with one tap, and the template follows the new report’s dates. Goals blocks show the goal period that matches the report’s month, so an October report keeps its October numbers after the month rolls over. We think a monthly report should take shape where the work and the numbers already live.
You can also ask Claude to publish or schedule your approved ideas, or cancel a scheduled post, right from the chat. Claude runs the same checks as the Publish screen first, and each post started this way carries a “via Claude” label on the idea, so your team sees where it came from.
More from the week: Compare on Insights puts up to four posts side by side, with the best values highlighted and, for YouTube, one retention chart with every post’s curve. Top posts in Reports draws from every post on your connected accounts, including the ones you didn’t publish through ContentCrew. Spot something good on Instagram? Share the link to ContentCrew and it opens as a new idea with the link attached as a reference. And the script image viewer flips through every reference image across all sections.
Open your next report and build it right on the page. Every change from the week is in the changelog.